Tuesday, October 14, 2025
Author: Feswal Abdallah
Category: Welfare, Public Finance, Taxation, Expenditure
⏱️ Estimated Read Time: 10 min read
Tuesday, October 14, 2025
Author: Feswal Abdallah
Category: Welfare, Public Finance, Taxation, Expenditure
Tuesday, October 14, 2025
Author: Feswal Abdallah
Category: Welfare, Public Finance, Taxation, Expenditure
Economic inequality is a lived reality both internationally and in Kenya. According to Oxfam, three billionaires now possess as much wealth as 160 million people combined worldwide. This underscores a staggering concentration of economic power in the hands of a few. In Kenya, employee nominal wages have grown at a compound annual rate of 8.6 per cent over the past five years, yet this increase remains modest compared to executive compensation. The average worker would need to labour for 26 years to earn what a CEO makes in just one year, revealing a deep structural imbalance in how value is rewarded across the economy. The income inequality is evident; bosses earn far more because the system gives them every advantage to build and pass down wealth. Regular workers, on the other hand, are left struggling from paycheck to paycheck with little chance to improve their lives.
Figure 1 shows Kenya's Gini coefficient, a number that represents the income inequality, the wealth inequality, or the consumption inequality within a nation, and a key measure of inequality in Kenya, which was 0.41 in 2015, 0.4 in 2023, and improved slightly to 0.39 by 2024, with projections indicating it will remain stubbornly high at 0.39 in 2025.
Figure 1: Kenya's Gini Coefficient from 2015 to 2024

Source: Authors Compilation from World Open Data 2025.
Despite this marginal improvement, nearly 38 per cent of the population still lives on less than 2.15$ per day. The World Economic Inequality Index ranks Kenya at 41.3, placing it in Grade D, a category defined as poor in terms of income distribution, and far behind more egalitarian economies such as the Slovak Republic at 100.0 or Slovenia at 98.1. Despite ambitious national budgets and well-intentioned social programs, deep disparities continue to cut across Kenya’s counties, sectors, and communities.
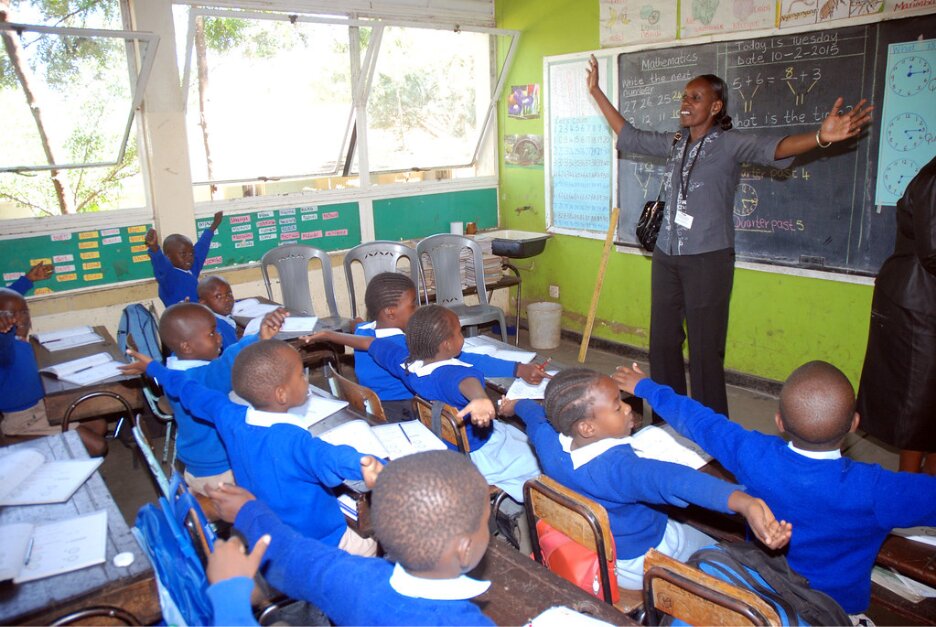
Table 1 shows national government expenditure concentrated in five sectors that primarily consist of public or quasi-public goods. These sectors receive the largest share of funding, yet this distribution may deepen existing inequalities as access to these services often varies across regions and social groups.
Table 1: National Government Expenditure Classification by Functions of Government, 2021/22-2024/25 (Ksh. Millions)
| Sector/FY | 2021/22 | 2022/23 | 2023/24+ | 2024/25* |
| Education | 474,054.17 | 580,058.09 | 713,534.56 | 703,387.97 |
| Health | 88,189.35 | 88,131.60 | 107,515.67 | 121,967.43 |
| Agriculture | 66,887.06 | 77,350.60 | 93,089.70 | 81,954.41 |
| Housing and Urban Development (Budgeted) | 9,970.0 | 9,133.00 | 25,492.00 | 86,499.00 |
| Transport | 315,453.98 | 190,884.33 | 188,012.33 | 254,873.85 |
| Social Protection | 172,838.05 | 172,806.19 | 192,763.34 | 232,251.02 |
Source: Authors' Compilation from the KNBS Economic Survey 2025
* Provisional
+ Revised estimates
As shown in Table 1, actual expenditures from 2021/22 to 2023/24, and 2024/25 being projected allocations offers a revealing glimpse into Kenya’s evolving fiscal priorities and their implications for inequality. Public finance is either a bridge to equity or a barrier that deepens inequality. Education and health have seen steady growth, reflecting increased investment in human capital; however, the absence of targeted delivery mechanisms limits their impact on the most vulnerable populations. Although agriculture remains central to rural livelihoods, diminishing policy and financial support may increase poverty and economic hardship. While agricultural production contributes to food availability, its outputs are largely private goods, and investment alone does not guarantee fair access or improved food security. Housing and transport show dramatic shifts, yet their impact depends on whether infrastructure reaches the underserved or reinforces urban privilege. Social protection stands out as a direct tool for inclusion, with rising allocations offering hope for vulnerable populations.
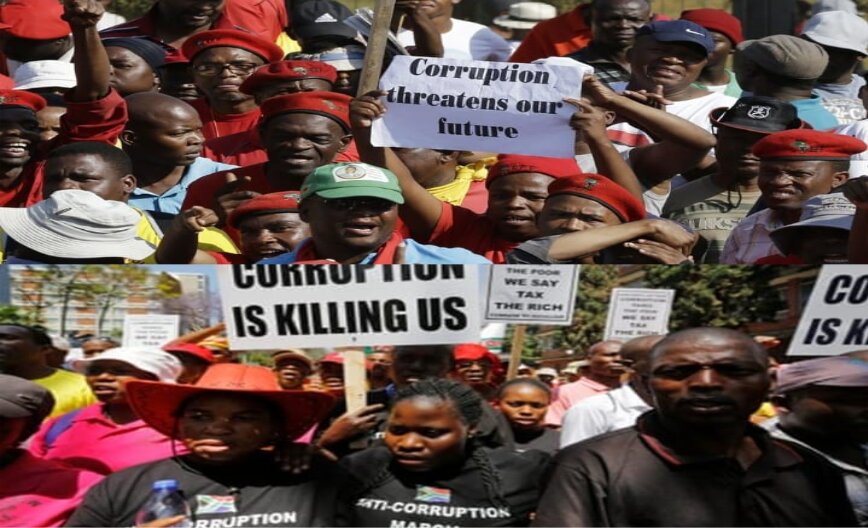
A Pew Research Center survey on “Economic Inequality Seen as Major Challenge Around the World” shows that, from across 36 countries, over half of the respondents view the gap between rich and poor as a major problem. While 60% believe the political influence of the wealthy significantly fuels inequality. These views show why it's important to create budgets that help most people, not just a small group.
The promise of public finance is clear: tax the wealthy, invest in the vulnerable, and level the playing field. But in practice, the outcomes vary wildly. According to the Pew Research Center, many citizens in various countries believe their economic systems need major reform to address inequality. And Kenya is no exception.
Despite the World Bank Data showing a decline in Kenya’s Gini index over the past three decades, which reflects some progress in reducing overall income inequality, this improvement conceals persistent disparities across regions, between urban and rural populations, and within structural systems. Fiscal policies have contributed to modest reductions in inequality, but limited coverage and the burden of indirect taxes, especially consumption taxes, have prevented meaningful progress in reducing poverty. The Kenya Poverty Report 2022 reveals that despite increased budget allocations to the social sector, one in three Kenyans remains income poor, and half the population suffers from multidimensional poverty. This resulted from fiscal policies that have failed to deliver transformative change due to limited coverage, inadequate targeting, and the disproportionate burden of indirect taxes. Table 2 highlights the top 5 most unequal counties and the bottom 5 least unequal counties in Kenya as of the Poverty report of 2022.
Table 2: Counties with Highest and Lowest Inequality
| Rank | Most Unequal Counties | Gini Index | Least Unequal Counties | Gini Index |
| 1 | Samburu | 43.00 | Nyandarua | 24.21 |
| 2 | Turkana | 37.78 | Makueni | 26.54 |
| 3 | Tharaka Nithi | 37.45 | Murang'a | 27.97 |
| 4 | Kajiado | 37.35 | Bomet | 28.20 |
| 5 | Nairobi | 36.84 | Embu | 28.20 |
Source: Authors' compilation from the KNBS Kenya Poverty Report 2022
Table 2 shows a vivid portrait of Kenya’s internal disparities, not just between rich and poor but between counties themselves. On one side are counties where inequality runs deep, entrenched and widening; and on the other are those with more balanced income levels, though not necessarily prosperous. This is evident from the rising poverty rates in already unequal counties.
The Kenya Continuous Household Survey of 2022 revealed stark contrasts in income distribution across counties. Samburu led as the most unequal, with a score of 43.00, followed by Turkana, Tharaka Nithi, Kajiado, and Nairobi. In Samburu and Turkana, inequality exists within poverty, where a few benefit from aid or land ownership while most remain excluded. Tharaka Nithi and Kajiado reflect uneven development, while Nairobi, despite having the lowest poverty rate, ranks fifth in inequality due to its sharp divide between affluent suburbs and informal settlements. Conversely, Nyandarua, Makueni, Murang’a, Bomet, and Embu show more balanced income distribution, likely due to agrarian economies and strong community networks. However, lower inequality doesn’t equate to prosperity; these countries still face challenges like poor infrastructure and limited opportunities. The data underscores that inequality is not just about wealth gaps, but about how opportunity is structured and shared.
An OXFAM analysis on inequality in Kenya suggests that by taxing effectively, we can as a country redistribute income and wealth while raising much-needed revenue to invest in quality, free public health and education services, which are proven to reduce extreme inequality. Kenya’s tax system does not adequately reflect the principle of ability to pay. Individuals who accumulate wealth through capital and financial assets are not taxed in proportion to their income. Progressive taxes on wealth—such as property levies and inheritance taxes—are essential tools for reducing inequality, as they target the richest households and help curb excessive concentrations of wealth and power. Taxation is one of the fiscal tools used by the current government to reduce inequality in Kenya. However, the data shows that the average salary for a Chief Executive Officer (CEO) is Ksh 1,768,743, but they will pay the same top tax rate of 35% as someone earning Ksh 47,059 in 2025. Where is the equity in Kenya’s tax system? Should the government focus solely on maximising revenue, without considering whether its tax policies and spending patterns reinforce inequality? True redistribution requires more than collections. It demands a deliberate commitment to fairness in both who pays and who benefits. Two taxes, Value Added Tax (VAT) and Flat Income Tax, when left unadjusted or poorly designed, entrench inequality. Progressive reforms like tiered income brackets, wealth taxes, or targeted VAT exemptions can flip the script. Is it the case in the Kenyan economy, or are we doing it differently? Figure 1 illustrates the imbalance in Kenya’s tax structure:
Figure 2: Comparison of National Government Gross Receipts on Recurrent Account (2020/21 – 2024/25)

Source: Authors' Compilation from the KNBS Economic Survey 2025
* Provisional
+ Revised
Figure 2 shows Kenya’s tax structure having a persistent reliance on consumption-based taxes, particularly Value Added Tax (VAT) and levies on other goods and services. Between 2020/21 and the projected 2024/25 fiscal year, VAT revenues have grown from Ksh 936 billion to over Ksh 1.3 trillion. In contrast, revenues from Pay-As-You-Earn (PAYE) and corporate income tax have increased from Ksh 694 billion to approximately Ksh 1.23 trillion. While both streams have expanded, VAT has consistently contributed more than half of total tax revenue, underscoring its dominant role in Kenya’s fiscal framework.
This reliance on VAT raises critical concerns about equity. VAT is inherently regressive: it applies uniformly to all consumers, regardless of income. While the Kenyan government exempts or zero-rates basic items, taxes on raw materials used to produce these goods often drive up final prices. This indirect burden falls hardest on low-income households, which spend a larger share of their earnings on essentials. Meanwhile, wealthier individuals, who save or invest more, are taxed less relative to their income, which deepens inequality.
Unlike income tax, which adjusts based on earnings, VAT applies uniformly, meaning both a CEO and a street vendor pay the same rate on essential items like flour or cooking oil. Though basic items are zero-rated in Kenya, the flat structure still limits the tax system’s ability to redistribute wealth, especially when input taxes inflate final prices.
Kenya’s fiscal trajectory must evolve from revenue maximisation to equity optimisation. As the economy expands and digitalisation deepens the tax base, the government should forecast and model tax reforms that prioritise progressive redistribution. This means designing tax reforms that not only raise funds but also actively correct structural imbalances.
A progressive tax, like wealth taxes that ask rich people to pay more on things like land, profits from selling assets and inherited wealth, can help prevent too much money from ending up in the hands of only a few people. Simultaneously, the government must reassess the VAT regime, which disproportionately burdens low-income households, and restructure it to exempt essential goods and services. These reforms should be guided by predictive analytics that identify vulnerable populations and anticipate economic shocks, ensuring that social protection programs are both responsive and inclusive.
In conclusion, Kenya’s budget is more than numbers; it reflects our values and shapes our future. Current policies have created exclusion through regressive taxes and uneven spending, but inequality is not destiny. It is a choice made through public finance. Every shilling spent or taxed can either deepen divides or build bridges. True nation-building means using the budget as a tool for inclusion, not exclusion, so that prosperity and dignity are shared by all, not limited by geography or income. Let the budget bring us together in fairness and opportunity. Kenya must choose fiscal justice not as an ideal but as a necessity. Continuing to reinforce inequality through regressive taxation and skewed spending is a political decision, not an economic requirement. A fair budget is not optional; it is the foundation of inclusive growth, national stability and shared dignity.